


The most actionable ML-ready dataset, now even bigger and more granular, for investors seeking...
A skeptic asked us to prove it. Here's what three years of data said.
We’ve said before that investing in healthcare without claims data is like navigating without GPS -- technically possible, but you’re going to miss turns that better-equipped investors won’t.
But a prospect recently pushed us further.
“Fine -- you have GPS. Prove it’s actually getting you there faster.”
The question was actually: “The market beats consensus something like 70% of the time. So how is Kyber Focal Methods actually adding value?”
Fair. And exactly the kind of question we want to answer -- not with a pitch, but with three years of data. So we pulled the analysis, ran it across roughly 8,900 product-quarter observations, and let the numbers respond.
.png?width=614&height=530&name=kyber-kfm-pullbox%20(1).png)
First, Let's Talk About That 70% Number
The figure isn’t wrong. Across the S&P 500, roughly 67–70% of companies beat revenue consensus in a typical quarter, according to FactSet. In strong earnings seasons, that number runs higher.
But here’s what that statistic is actually measuring: company-level results, across every sector, shaped by everything from cost cuts to currency moves to one-time items. It’s a blunt instrument. And it has almost nothing to do with how individual drug products behave against Wall Street estimates.
Pharma and biotech play by different rules. Patient uptake curves, payer mix shifts, specialty pharmacy channel dynamics, deductible resets, inventory stocking -- these are forces that Wall Street analysts, working top-down from company guidance, routinely underestimate or miss entirely. The result is a product-level consensus landscape that’s genuinely harder to forecast than the broad market. Beats and misses are less predictable. The surprises -- in both directions -- are more frequent and more meaningful.
That’s not a weakness of the sector. It’s an opportunity. And it’s exactly the terrain Kyber was built for.
Setting the Right Baseline
To answer the challenge properly, we needed to measure KFM’s performance against the right benchmark -- not the broad market beat rate, but the rate at which pharma and biotech product revenue beats Wall Street consensus with no model at all. We call this the baseline beat rate.
The analysis covers 2023Q2 through 2026Q1 -- three full years, roughly 8,900 product-quarter observations across multiple channels. One methodological note worth flagging: we exclude predictions where the model estimate falls within ±1% of consensus. When a model and consensus are that close, there’s no meaningful directional signal to measure, and including those rows would artificially dilute the results. We’d rather show you an honest number.
What We Found: KFM Outperforms Consensus
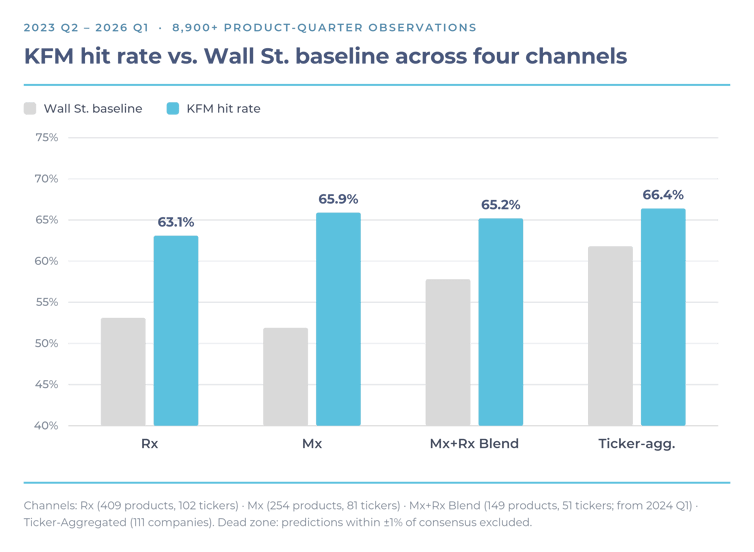
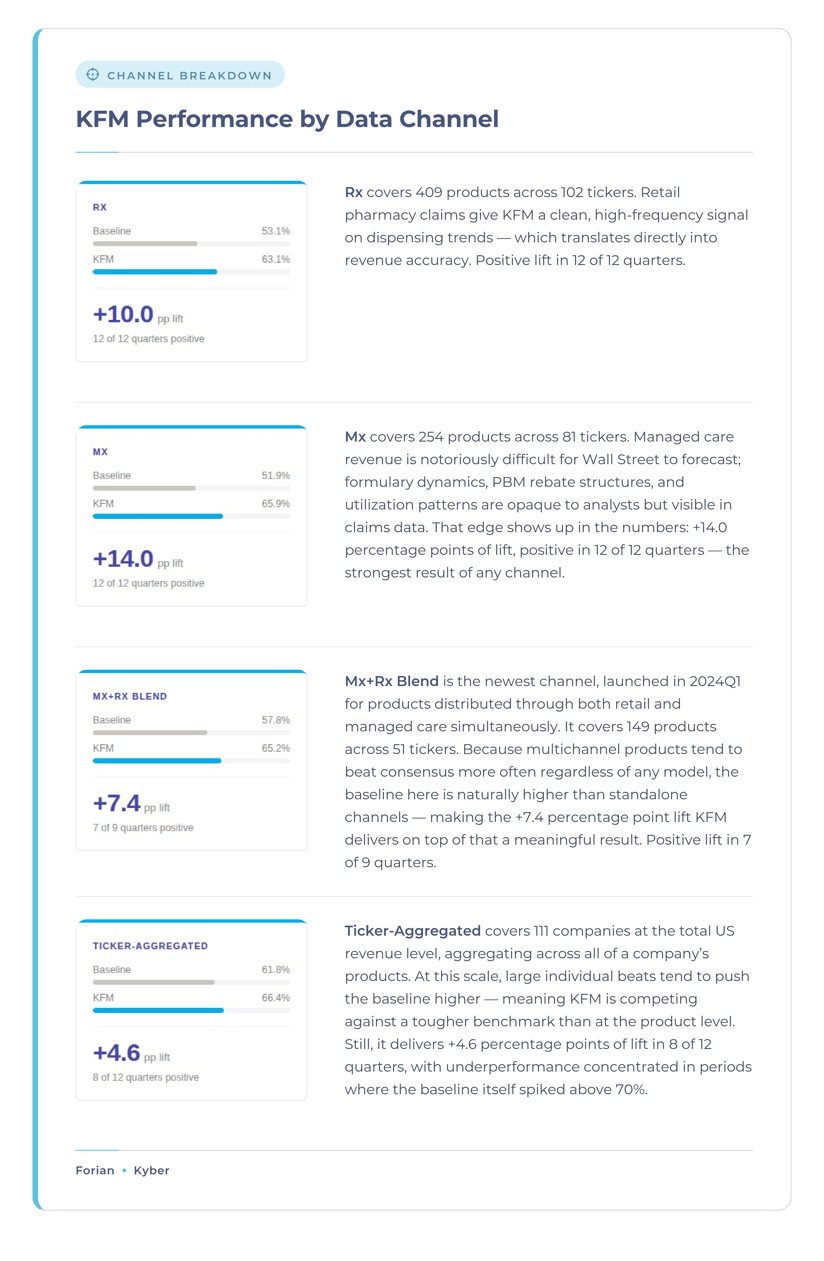
KFM adds genuine, consistent lift above the baseline across every channel.
The Company View: Rolling It All Up
Here’s where the methodology matters -- and where the story gets more interesting for investors who want a company-level view.
Most analysts building a ticker-level revenue estimate start from the top: company guidance, macro sector assumptions, historical beat patterns. They work down to products. It’s the natural direction of travel when you’re working from the outside in.
Kyber works the other direction. We start at the product level -- individual drug claims, channel-specific signals, machine learning models backtested against years of real results -- and roll up to the ticker. By the time we arrive at a company-level revenue estimate, it’s been built from the ground up on product-level accuracy.
The result is our Ticker-Aggregated channel: US revenue estimates at the company level, derived from product-level claims intelligence rather than top-down guidance. The baseline beat rate here runs around 62% -- higher than either standalone channel, because large company revenue figures can absorb many individual product variances. KFM still delivers a lift to 66%, positive in eight of twelve quarters.
The four quarters without positive lift were concentrated in periods when the baseline itself spiked above 70% -- approaching the broad-market beat rate our prospect assumed was the norm. When the whole sector runs hot, any model faces compression. What matters is that Kyber’s product-level foundation gives the company-level view a more durable basis than top-down assumptions built on guidance alone.
Bottom-up beats top-down. The data agrees.
The Quarterly View: A Distinct Advantage in Q1
Collapse three years of data into a single calendar view and one pattern emerges immediately: Q1 is consistently the weakest quarter for the baseline beat rate -- somewhere in the 45–50% range depending on the channel. Deductibles reset. Annual guidance is still settling. Consensus is at its most uncertain.
That’s also the quarter where KFM delivers its largest relative lift.
It makes intuitive sense. When the market is most in the dark, a model built on early claims data and backtested signals has the most room to run. Kyber clients arrive at Q1 earnings season having already had weeks to form a view -- while the rest of the street is still adjusting its eyes to the light.
Performance Filtering Sharpens the Edge
Performance filtering matters too. When we restrict the analysis to products where the model has historically performed well -- filtering on model error, historical hit rate, and the degree to which the model diverges meaningfully from consensus -- lift improves materially across all channels.
The Ticker-Aggregated channel in particular shows the largest sensitivity to filtering, suggesting that model performance is concentrated in a subset of well-covered companies. That’s useful information for how to use the tool, not a reason to doubt it.
So, Does KFM Add Value?
The prospect who challenged us with the 70% figure wasn’t wrong about the broad market. They were applying the wrong map to unfamiliar terrain.
Pharma and biotech product-level revenue doesn’t behave like the S&P 500. The consensus is harder to beat. The surprises are more frequent. And the information asymmetry between those with claims data and those without is larger than in almost any other sector.
Three years of data, multiple channels, one answer: yes, KFM adds values – consistently and meaningfully when the market needs it most.
The data is in. If you want to see how it applies to your coverage universe, we can show you.
Analysis period: 2023Q2–2026Q1. Channels: Rx, Mx, Mx+Rx Blend, Ticker-Aggregated. Dead zone: ±1% of consensus excluded. Hard filters applied to remove negative error values prior to analysis.
© 2026 Kyber Data Science LLC. All rights reserved. This material is offered by Kyber Data Science for informational purposes only. Nothing contained herein constitutes an offer to sell or a solicitation of an offer to buy any security or an offer to provide any investment banking, investment advisory or brokerage services. Neither Kyber Data Science nor any of its affiliates, including its parent, Forian Inc., intends to provide investment advice through the use of this material and none of Kyber Data Science or its affiliates make any representation that any described securities or services are suitable for any investor. Products offered by Kyber Data Science are not Research Reports as defined by FINRA regulations.
.png?height=200&name=Kyber%20Blog%20Cover%20Image%202%20(1).png)
